
Understanding HRV
Heart Rate Variability (HRV).
You’ve probably heard of Heart Rate Variability (HRV) by now - but how much do you really understand it?
The History
HRV was first detected in 1733 by Stephen Hales who noticed changes in arterial pressure linked to breathing. In 1847 Carl Ludwig noticed that the timing between individual heart beats varied alongside whether someone was inhaling, or exhaling. During inhalation (breathing in) heart rate quickened (ie the time between each beat shortened). During exhalation, the heart rate slowed (ie the time between each heart beat lengthened). This phenomenon was termed ‘Respiratory Sinus Arrhythmia’ (RSA).
Post Ludwig, RSA then largely ‘sat on a shelf’, and was rarely explored until the 1960’s & 70’s.
In the 1970s, researchers such as Ewing and colleagues created bedside tests to detect autonomic neuropathy in diabetic patients. In 1977, Wolf et al. first showed that reduced HRV was associated with higher risk of post-infarction mortality. In 1981, Akselrod introduced spectral analysis (power spectral density) to quantify beat-to-beat variability, moving beyond time-domain measurements.
In 1996 with a joint report by the European Society of Cardiology and the North American Society of Pacing and Electrophysiology, establishing the standard methods for measuring and analyzing HRV, which are still in use today.
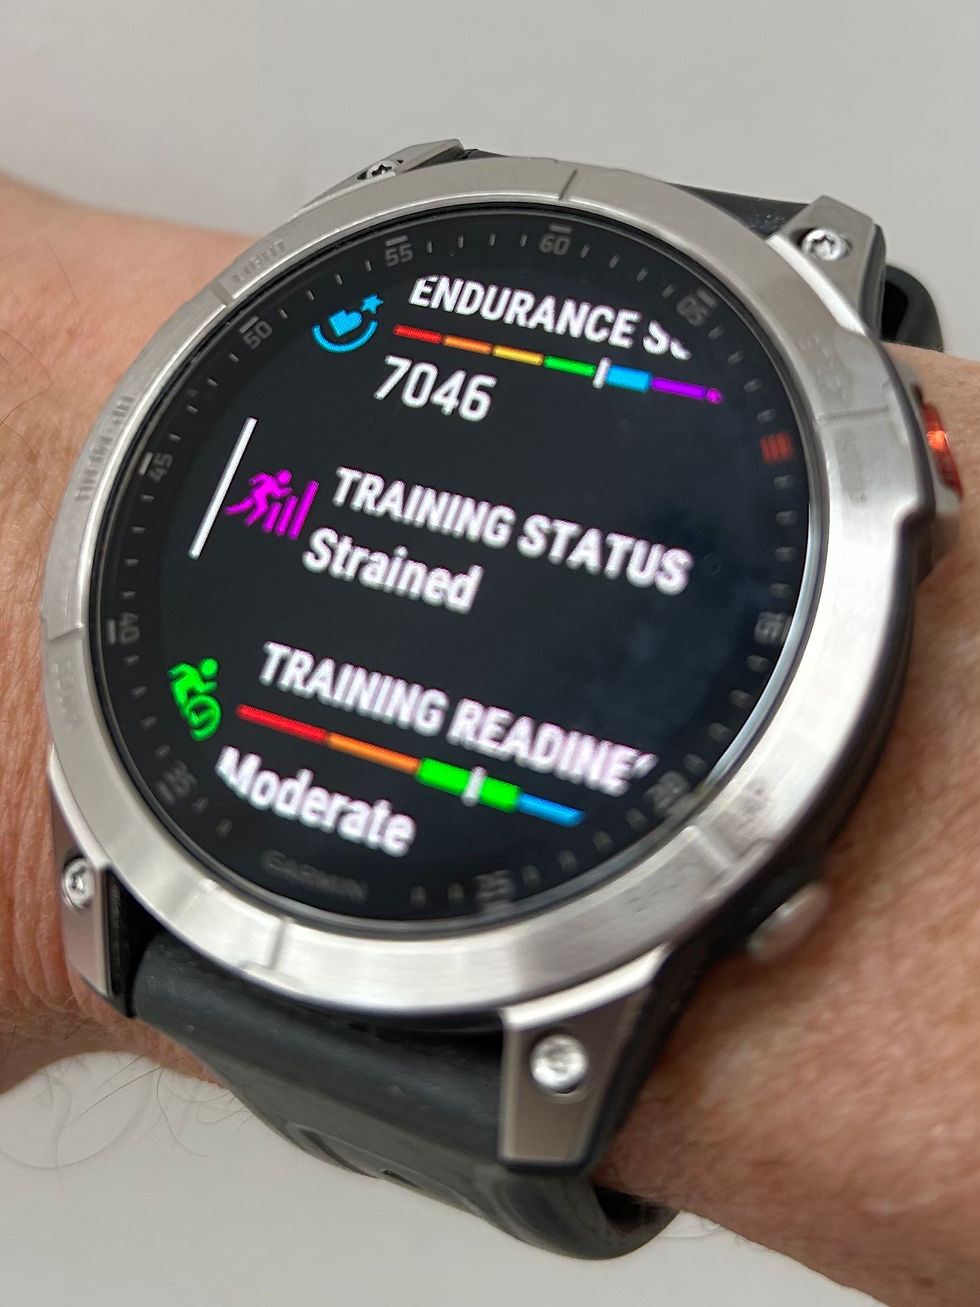
Currently, HRV is routinely measured by wearable technology. Whoop, Garmin, Oura and many other brands, are ploughing money into HRV research, so that we can better understand training effectiveness and periodisation.
The Physiology
Heart rate variability (HRV) is essentially a window into how your autonomic nervous system is regulating your body from moment to moment. Because our autonomic nervous system is beyond our conscious control, HRV is therefore seen as a true reflection of our inner fitness & health.
Your heart is controlled by the autonomic nervous system (ANS), which has two main branches:
Sympathetic nervous system (“fight or flight”)
Speeds up heart rate
Prepares you for action, stress, or exertion
Tends to reduce variability between beats
Parasympathetic nervous system (“rest and digest”)
Slows heart rate via the vagus nerve
Promotes recovery, digestion, and relaxation
Increases beat-to-beat variability
HRV reflects the balance and flexibility between these two systems. A higher HRV generally means your body can rapidly shift between activation and recovery - and this adaptability is a sign of resilience.
How HRV is measured - The PQRST wave

You’ve probably all seen ECG diagrams either via your studies at school, college or university, or on films during hospital scenes! To understand how HRV is measured, we must understand how the heart works - including this PQRST wave.
Like any muscle, the heart requires an electrical impulse in order to contract. Now the heart is an unusual muscle in that it is made up of four chambers. Therefore, the electrical impulse is fairly complex (see above). The PQRST wave on an ECG shows how the heart chambers depolarise and repolarise in a sequence. Let's look into what each segment represents.
1. P Wave. The P wave represents the depolarisation of the atria, which precedes atrial contraction.
Onset: This marks the start of atrial depolarisation.
Offset: This is the end of atrial depolarisation.
The P wave should be smooth and rounded. Abnormalities in the P wave's shape, size, or timing can indicate atrial enlargement, atrial fibrillation, or atrioventricular blocks.
2. PR Interval. The PR interval encompasses the period from the onset of the P wave to the beginning of the QRS complex. It shows how long it takes for an electrical signal to move from the top to the bottom of the heart. Measuring the P-R interval records electrical impulses traveling from the atria to the ventricles through the AV node.
Normal Range: 0.12 to 0.20 seconds.
Prolonged P-R Interval: May suggest first-degree heart block.
Short PR Interval: May indicate pre-excitation syndromes such as Wolff-Parkinson-White syndrome.
3. QRS Complex. The QRS complex represents the rapid depolarisation of the ventricles, leading to ventricular contraction. It typically consists of three waves: Q, R, and S.
Q Wave: Initial negative deflection, indicating septal depolarisation.
R Wave: Positive deflection representing the bulk of ventricular depolarisation.
S Wave: Negative deflection following the R wave, representing the final depolarisation of the ventricles at the base.
The duration of the QRS complex is usually less than 0.12 seconds. Prolonged QRS duration can suggest bundle branch block or ventricular hypertrophy, while abnormal height and depth might indicate myocardial infarction or ventricular hypertrophy.
4. ST Segment. The ST segment follows the QRS complex and starts at the end of the S wave to the beginning of the T wave. It represents the period when the ventricles depolarise.
Normal: The ST segment should be flat (isoelectric).
ST Elevation: Can indicate myocardial infarction or pericarditis.
ST Depression: May suggest myocardial ischemia or digoxin effect.
5. T Wave. The T wave corresponds to the repolarisation of the ventricles. This allows them to reset for the next cycle of depolarisation.
Shape: The T wave should be upright and rounded in most leads.
Inversion: T wave inversion can indicate ischemia, left ventricular hypertrophy, or central nervous system disorders.
Peaking: In hyperkalemia, tall, peaked T waves may appear.
6. QT Interval. The QT interval measures the total time for ventricular depolarisation and repolarisation. This extends from the start of the Q wave to the end of the T wave.
QT Interval Normal Range: Varies with heart rate but is generally less than 0.44 seconds.
Prolongation: Prolonged QT interval can predispose to ventricular arrhythmias like Torsades de Pointes.
And finally, what you really want to know…
7. R-R Interval. The R-R interval is the time between each Ventricular contraction! This is what we use to measure HRV.
What’s Actually ‘Varying’?
Even though we often think of heart rate as steady (say, 60 beats per minute), the time between each beat is actually constantly changing - and that variation is meaningful. HRV measures the variation in time between consecutive heartbeats (R-R intervals on an ECG). For example:
One beat might occur 0.92 seconds after the last
The next might occur 1.05 seconds later
That subtle fluctuation is driven largely by parasympathetic (vagal) activity, especially in response to breathing.
Drivers of Heart Rate Variability
HRV is not solely influenced by your fitness level or training. Changes in HRV are nuanced and could be caused from any or all of the following:
Breathing and HRV (Respiratory Sinus Arrhythmia)
One of the biggest drivers of HRV is your breathing pattern:
Inhale → heart rate speeds up slightly
Exhale → heart rate slows down
This phenomenon is called respiratory sinus arrhythmia (RSA) and is a direct marker of vagal tone. Slow, controlled breathing tends to amplify HRV.
Brain - body connection
HRV is also influenced by higher brain centers:
The prefrontal cortex and limbic system regulate emotional responses
These areas communicate with the heart via the vagus nerve
That’s why stress, anxiety, or even rumination can lower HRV
In contrast, calm, regulated emotional states tend to increase HRV.
Hormones and inflammation
HRV is sensitive to internal physiological states:
Cortisol (stress hormone) → lowers HRV when chronically elevated
Inflammation or illness → reduces HRV
Recovery states (deep sleep, good nutrition) → increase HRV
Exercise stress levels
HRV reflects the volume and intensity of training that you are doing. If you are exceeding a healthy dose-response (ie over-reaching or over-training), then HRV will reduce.
If you are getting your training stimulus right, then HRV will stay the same or even increase over time.
Lifestyle
Smoking, alcohol and other drugs and even medicines can adversely affect HRV
Nutrition
The foods you eat and even the timing you eat them, can affect HRV. Late night snacking on carbohydrates can often lower your HRV - however, this is less problematic if you are fit and adapted to eating carbohydrates - likely due to increased insulin sensitivity.
BMI
If you are overweight or obese, then you are likely to have reduced HRV.
Medical conditions
Medical conditions including Metabolic Syndrome, will likely adversely impact HRV.
Sleep
It’s not just about getting enough hours of sleep. It’s also a matter of getting good quality sleep! Whoop have now measured the average duration of sleep of 100’s of thousands of people. They have found that the fittest people get up to 1.5 hours more sleep than the least fit and this shows in their improved HRV. They also get better quality sleep by having a better sleep routine. They go to bed at the same time every day and wake up at the same time every day. Broken sleep patterns, do not promote a healthy HRV.
HRV Individuality and What it Tells Us.
It’s important to remember that HRV numbers are individual. You may hear of people who have HRV as high as 200ms - Matthieu Van Der Poel the elite cyclist just revealed this figure via his Whoop affiliation! It is also possible for individuals to have HRV as low as 25ms. Although the number matters, what matters most is your individual HRV and how it changes on a day to day and a long-term basis.

Whilst it is true that higher HRV is perceived as being better, the MOST important factor is that your HRV stays consistent to YOUR numbers. Consistent HRV shows that your life is balanced, controlled and that your systems are working optimally. Inconsistent HRV shows that something you are doing is wrong, whether that be psychological stress, training, lifestyle or medical condition.
HRV Coefficient of Variation (HRVCV)
To measure consistency of HRV, we should look at each individual day, and compare it to the rolling 7 day average. This is often termed ‘HRV Coefficient of Variation’ (HRVCV). Ideally, each individual HRV value should be within 10% (above or below) the 7 day average.
The Numbers:
90-200 - Fitness levels and health likely to be elite level
70-90 - Fitness levels and health likely to be a high level
40-70 - Often show an average fitness and health level
<40 - Fitness levels and health often below average
NB. These numbers are a guide and there are some outliers that do not fall within these ranges who are both fit or unfit!!
Deviance:
<10% - stable
>10% - increasingly unstable
NB. Remember, causes of HRV instability are multi-factoral!!
Real Life HRV Examples
The following examples were taken from my own HRV profile. The numbers are taken from a Garmin-produced overnight average HRV.
The below graph shows my HRV from 4th Feb - 3 March.
Context - this was a month when I increased my training volume a lot! I included a mix of Zone 2 bike rides and runs. I slept well and I ate well. I had very little psychological stress and medical illness.

You can see that towards the middle of the month I had two nights where my HRV was ‘unbalanced’ (ie HRVCV) was beyond that which Garmin deems unacceptable. The cause was likely to be ‘over-reaching’ in my training (ie, a little too much volume too soon). You can see the knock on effect for the rest of the month.
The following month, the graph showed a different trend:
Context: I felt more comfortable with my training volume by now. I slept well, ate well and again, had zero psychological stress or medical illness.

Here you can see the HRV value gradually rising as a consequence of the good training and recovery I was getting. There were zero unbalanced days!
And now for a shocker of a month for HRV!!!.....
Context: During this month, training intensity went up, whilst volume came down. However, additionally, stress levels went up, sleep was poor, I got a virus and I did a 200km gravel bike race!
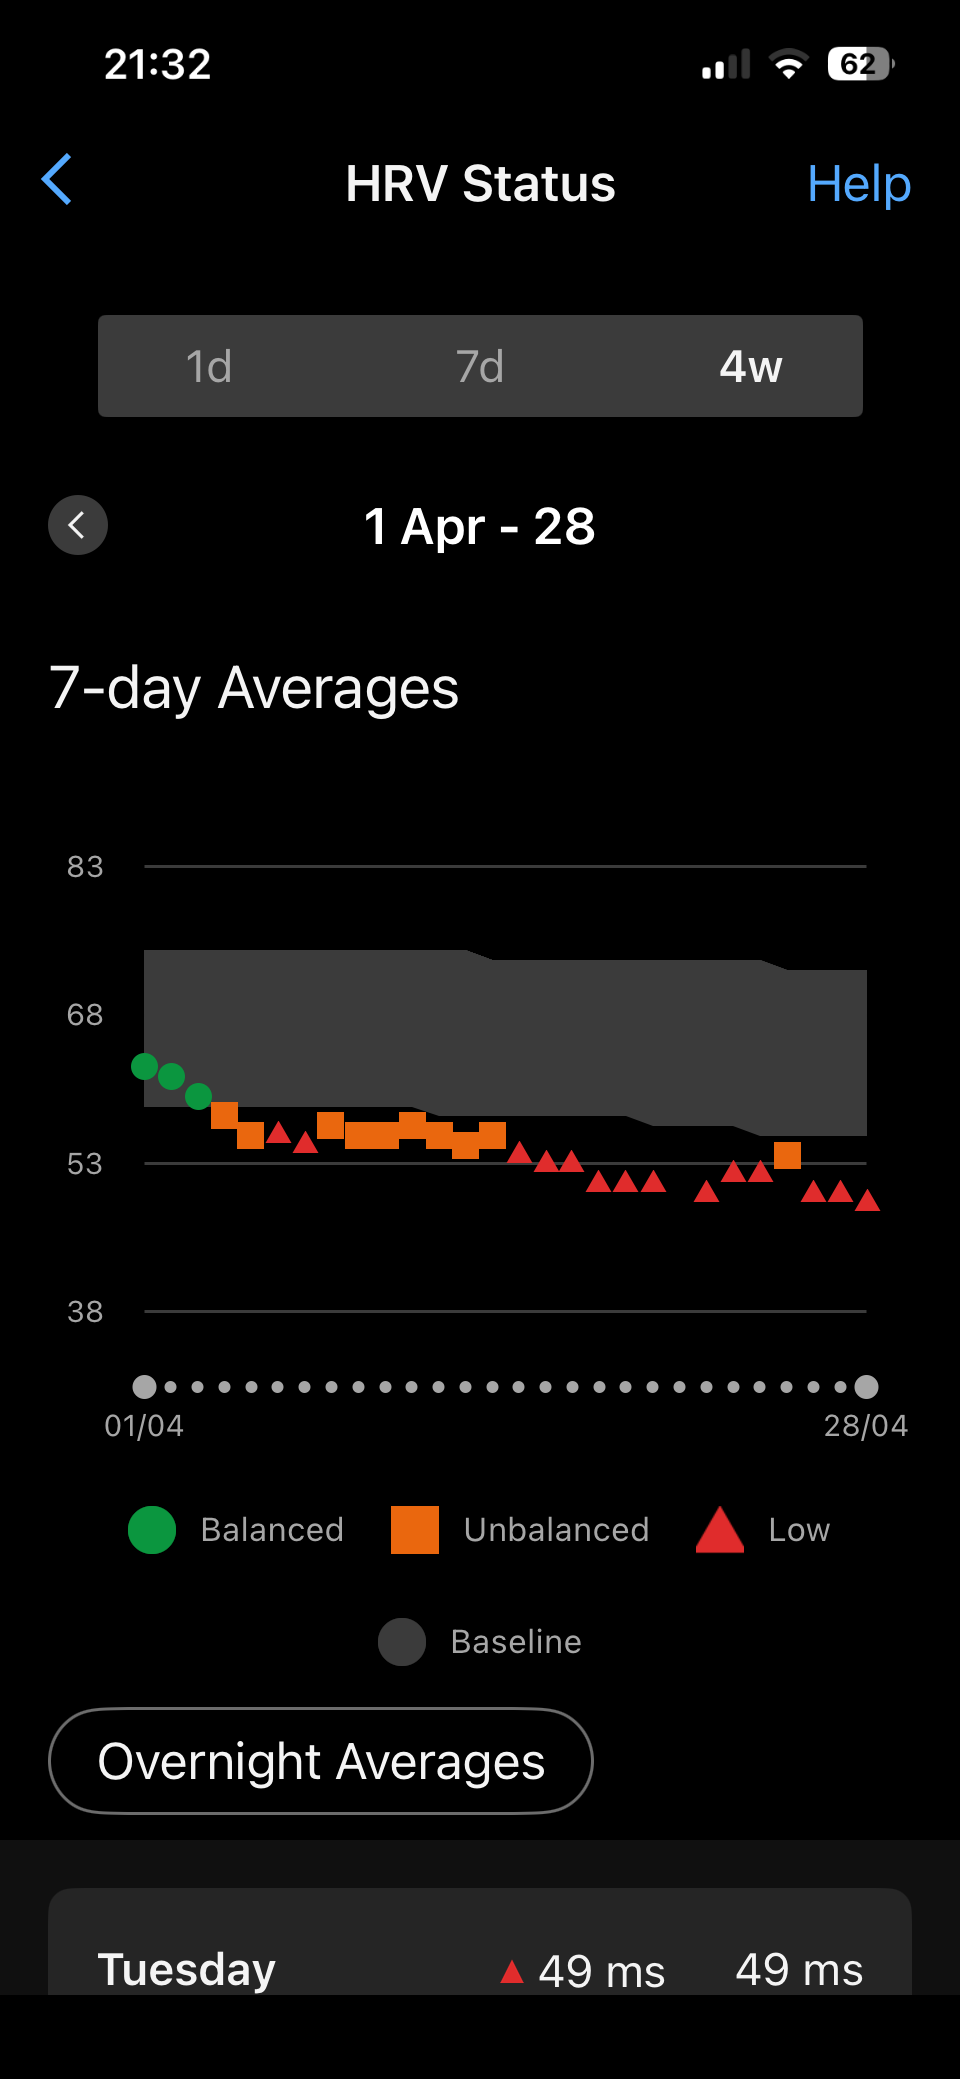
Here you can clearly see how my HRV became unbalanced due to intensive training, then became ‘low’ due to illness. To top off my HRV woes, the 200km bike race left my HRV unbalanced as well as low!
How to Improve Your HRV
As so many factors can negatively affect HRV, it makes sense that the same factors can be used to improve HRV!
Practice breathwork
Control your stress levels
Understand your hormone levels
Reduce causes of inflammation
Periodise your training
Improve our lifestyle
Improve your nutrition (especially reducing alcohol intake)
Reduce BMI
Get health conditions under control
Practice good sleep habits
Let’s look specifically at periodisation of training - as that is where HRV can play a pivotal role.
Your training should be designed in such a way that there is ‘progressive overload’ over an extended period of time. This should involve a cycle of:
Alarm (training stimulus). The level of alarm will depend upon the intensity, time and type of training you are doing.
Adaptation (recovery). The ability to recover will depend upon rest, sleep, nutrition quality as well as how frequently you are completing the prescribed training.
Supercompensation (improvement in body’s ability to handle that training load). This will depend upon whether you are given adequate rest to fully adapt to the training stimulus.
HRV can be used as a measure of how this cycle is working for you. Too intense or frequent training, along with too little rest or inadequate nutrition will be shown by a lowered or unbalanced HRV.
HRV Guided Training and Living
HRV numbers, if used wisely, can be a fantastic tool to guide our training and living. When we get things right with our training and see consistent HRV improvements or balance, we should replicate what we are doing. Conversely, when we see declines in HRV or unbalanced numbers, then we should review why those numbers are adversely being affected. Remember - the numbers alone do not tell you the ‘why’. It is the conversations with yourself, your family, your GP, your coach etc that will offer you the greatest insight.
To get the most out of HRV you should make notes. Have a training log or diary that documents all the factors that affect HRV. Wearable technology and apps such as ‘My fitness Pal’ have made this task relatively easy. Small changes to our daily training and living can have a huge effect on our HRV and consequently, our fitness and health progression.
If you have enjoyed reading this blog, you might want to complete the associated quiz. You will need a free Google account to login). Complete 7 more to gain a FREE CPD certificate!
All the best,
Paul

Comments